Market Perspectives February 2021
Capital Markets
By: Wade Austin
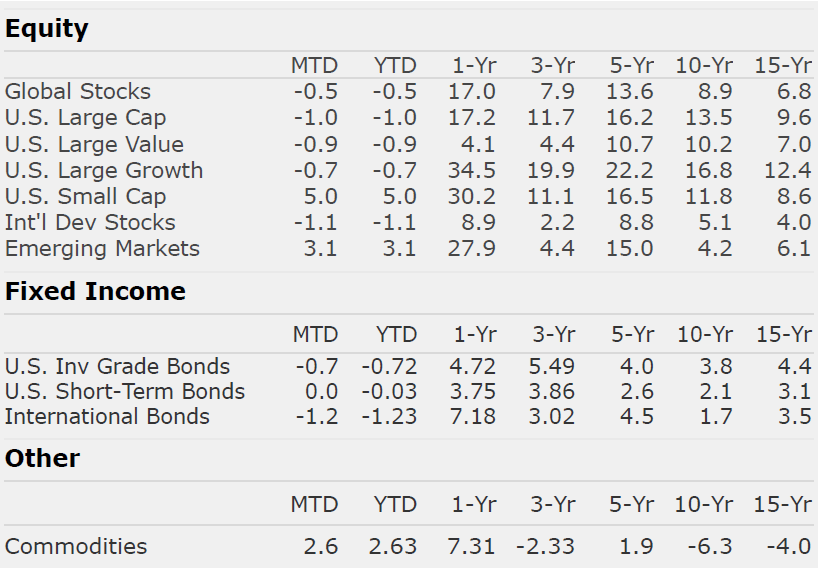
Stocks rode their post-election momentum into 2021 until a late bout of intense volatility during the last week of January erased the S&P 500 gains for the month. U.S. equities posted their worst week since October with large-cap and small-cap stocks declining -3.3% and -4.4%, respectively. Despite the pullback, small-cap (+5.0%) and emerging market stocks (+3.1%) still managed healthy returns for the month.
Lingering concerns about the vaccine deployment and rising virus cases, hospitalizations, and deaths created pockets of volatility during January. However last week’s wild ride was mostly attributable to a historic ‘David vs. Goliath’ short-squeeze battle. Individual investors banded together leveraging social networks to bid up the price of heavily shorted stocks and successfully short-squeezed powerful hedge funds.
We do not pretend to know the long-term implications of this nascent pooled individual investor phenomenon, but the threat of new regulatory oversight weighed on markets immediately. Following a timely weekend break, equity markets rebounded sharply while the stocks at the center of the chaos began their inevitable descent back towards their fundamentals-based reality. The Reddit-fueled market frenzy vividly illustrates why we focus on the long term and not fly-by-night investments.
In a positive sign for the economic recovery, 10-yr. U.S. Treasury yields ticked above 1% for the first time since the pandemic began, ending the month 18 bps higher at 1.11%. Modestly negative total returns for U.S. Treasuries and investment-grade corporate bonds pulled the aggregate bond index down for the month (-0.72%). Municipal bonds led fixed income markets in January posting a solid +0.64% total return.
Fed Chairman Powell continued to project a dovish tone in January and reiterated that it was premature to discuss increasing interest rates or reducing asset purchases. His suggested timeline for doing so was even farther out than expected.
While equity valuations are clearly elevated with the forward P/E ratio of the S&P 500 at 21.3 compared to its recent 20-year average of 15.4, current conditions under this ultra-accommodative Fed continue to favor stocks over bonds. Inflation remains low, credit spreads have tightened, and corporate earnings are being revised upward. Accordingly, the relative performance of stocks vs. bonds reached recent highs this week.
We do expect January’s heightened volatility to persist and would not be surprised by a correction. Our antennae are up. However, we also resist the temptation to try and time this market, especially absent most of our major bull market top signals.
The personal savings rate in the U.S. is 13.7% – much higher than the pre-pandemic level of 8% and provides ample capital for increased consumer spending in the Spring. With the vaccine deployment ramping up faster than the political headlines suggest and more government spending on the way, any near-term softness is likely to be short-lived.
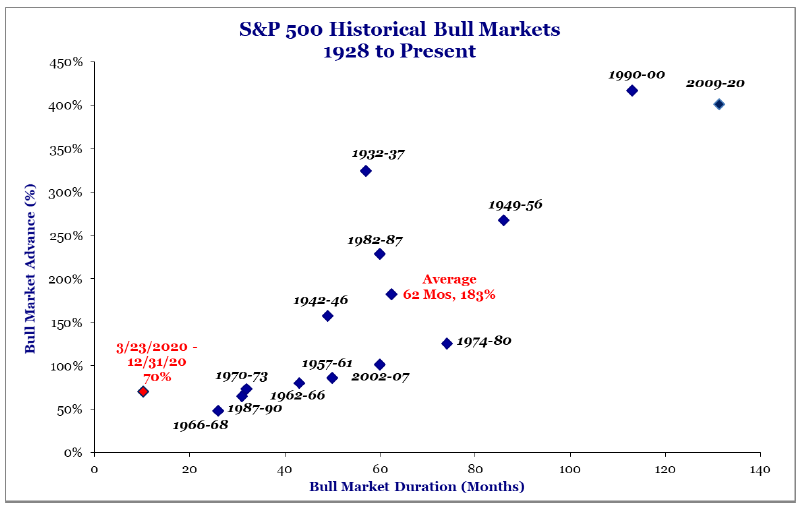
As John Silvia, CIC’s Director of Economics, reminds us and our Chart of the Month implies, investors should be rewarded for taking a long view consistent with their goals and comprehensive financial plan.
Insights by John Silvia, Director of Economics
Latest GDP estimates for the fourth quarter of 2020 showed a gain of 4% for the overall economy with a solid performance for both residential (housing) and business investments Inflation remains modest, but the market’s assessment of inflation is moving upward. Meanwhile, 10-year benchmark Treasury interest rates are also moving upward.
- Indicators support continued growth going forward. Manufacturing surveys point to stronger orders, production and employment. Commodity prices such as copper and oil are consistent with increasing industrial production. Therefore, the outlook favors better economic growth. We also note that with better growth comes higher inflation and interest rates.
- Gradually, vaccinations are becoming more widespread, and this will offset the reoccurrence of mandated shutdowns in some states that have weakened the economic outlook for leisure and hospitality sectors.
- There are global differences in the outlook that would merit a review of your global portfolio. The outlook for stronger growth in Asia remains as we have witnessed from the China trade and PMI surveys. However, the Euro area appears on the precipice of a recession. Emerging markets benefit from exports to industrialized U.S. and Asian economies along with rising commodity prices.
- The consumer engine, the largest component of the economy, continues to be supported by both jobs and income gains. Looking forward, re-opening the economy will lead to further jobs and income gains. In addition, household wealth remains at an all-time high in the latest quarter as equity values and home prices continue to rise.
- Each recession/recovery presents structural challenges to certain segments of the economy such as commercial real estate and hotels. Even here, however, recent prices have attracted long-term investors who anticipate a turnaround in communities with favorable demographic and job trends. This has not changed.
Clients have been rewarded by following the fundamentals and taking a longer view of their position. Recessions are part of the economic cycle, but recovery and expansion are longer lasting. This has not changed. However, inflation and interest rates are rising and there are growing disparities in the global outlook. All this merits a portfolio review with your financial advisor.
Quote of the Month
“Compound interest is the eighth wonder of the world. He who understands it, earns it. He who doesn’t, pays it.”
Albert Einstein
The information published herein is provided for informational purposes only, and does not constitute an offer, solicitation or recommendation to sell or an offer to buy securities, investment products or investment advisory services. All information, views, opinions and estimates are subject to change or correction without notice. Nothing contained herein constitutes financial, legal, tax, or other advice. The appropriateness of an investment or strategy will depend on an investor’s circumstances and objectives. These opinions may not fit to your financial status, risk and return preferences. Investment recommendations may change, and readers are urged to check with their investment advisors before making any investment decisions. Information provided is based on public information, by sources believed to be reliable but we cannot attest to its accuracy. Estimates of future performance are based on assumptions that may not be realized. Past performance is not necessarily indicative of future returns. The following indexes were used as proxies in the performance tables: Global Stocks = MSCI ACWI; U.S. Large Cap = S&P 500; U.S. Large Value = Russell 1000 Value; U.S. Large Growth = Russell 1000 Growth; U.S. Small Cap = Russell 2000; Int’l Dev Stocks = MSCI EAFE; Emerging Markets = MSCI EM; U.S. Inv Grade Bonds = Barclays U.S. Aggregate; U.S. High Yield Bonds = Barclays Corporate High Yield; Emerging Markets Debt = JPMorgan EMBI Global Diversified; Int’l Bonds = Barclays Global Treasury ex US; Cash = 3month T-Bill; Sector returns displayed in the chart represent S&P 500 sectors, while treasury benchmarks are from Barclays
Sources: Strategas


