Market Perspectives September 2024
Capital Markets
By: Wade Austin
August was marked by heightened volatility across global financial markets, reflecting the complex interplay between central bank actions, inflationary concerns, geopolitical uncertainties and economic growth forecasts. Here’s a breakdown of the key themes:
Equity Markets:
- Equity markets sold off in early August for only a few days due to softer economic data and the Japanese yen carry trade unwinding. Two days later, the S&P 500 burst back on an 8-day winning streak, its longest of the year. For the past four years that experienced an 8-day winning streak, their average calendar year return was 26.2%.
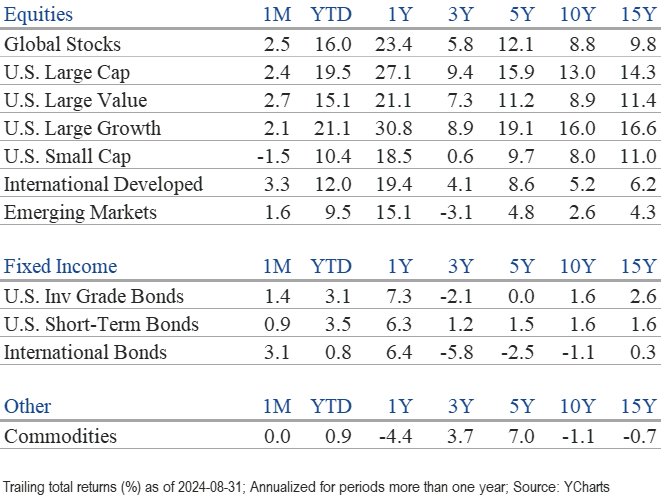
- The S&P 500 ended August at 5,648, its second-highest close in history. The U.S. large-cap index logged a 2.4% gain for the month and its fourth straight monthly gain. Its YTD gain was 19.5%.
- Small-cap stocks retreated -1.5% in August after spiking more than 10% in July. While expectations for a September rate cut accelerated mid-summer, softer economic data took some wind out of their sails.
- Large-cap value stocks (+2.7%) outperformed large-cap growth (+2.1%) for the month, as investors became more sensitive to lofty tech valuations. The Mag 7 stock performance relative to the S&P 500 peaked in July at +27% but has since declined to +12%. Amazingly, the Mag 7 is spending more on capex and R&D than the other 493 S&P 500 companies combined! Expectations are high that these tech giants’ historic investments in the AI arms race will translate to higher profits, leaving no margin of safety for delays or disappointments. Nvidia saw its stock decline after its forward guidance fell short of investors’ hyperbolic growth targets.
- Nine of the 11 major S&P 500 sectors advanced, led by consumer staples (+5.9%) and real estate. Energy (-1.7%) and consumer discretionary sectors declined.
Bond Markets:
- The U.S. 10-year Treasury note was choppy last month but ended 13 bps lower at 3.91%. It closed higher than the 2-year Treasury on Aug. 28, marking the first time it was not inverted since July 2022.
- Fed Chairman Jerome Powell’s declaration that “the time has come” for rate cuts at his Jackson Hole address in late August fueled the market’s easing expectations. U.S. Treasury yields fell across the curve, delivering another solid month of gains for U.S. bonds.
- The Bloomberg U.S. Aggregate Bond Index returned 1.4% in August and climbed to 4.8% YTD. More significantly, bond prices rose during the brief periods that equities struggled, providing ballast to balanced portfolios.
- High-yield credit spreads, a dependable gauge of economic expectations, were volatile but finished the month tighter. High yield corporate bonds (+1.63%) slightly outperformed investment-grade corporates (+1.57%).
Key Takeaways:
- Market leadership has been broadening beyond technology stocks and the Mag 7 since mid-July. Upward earnings revisions for the rest of 2024 and 2025, among the other 493 collectively, is a positive sign for the overall market’s health.
- The likelihood of Fed easing and the variety of fiscal and regulatory tools still to be used before the election suggests it is difficult to be too bearish in the short term. The longer-term challenges will likely include mounting interest expenses and U.S. budget deficits. Absent productivity or employment growth, interest rates would likely rise again once the federal government’s bills eventually come due.
- While softer economic data has recently dampened the optimism for a soft landing, we still don’t expect a recession any time soon. Therefore, our base case remains that Fed cuts will be consistent with mid-cycle adjustments instead of pre-recession panic cuts. Last month’s Chart of Month revealed that when a recession was avoided during the 12 months following a new Fed rate cutting cycle, the S&P 500 climbed an average of 19% over those next 12 months.
- September has historically been one of the weakest months of the year. However, the worst Septembers have occurred when the market was already in a downtrend, which is not the case this year.
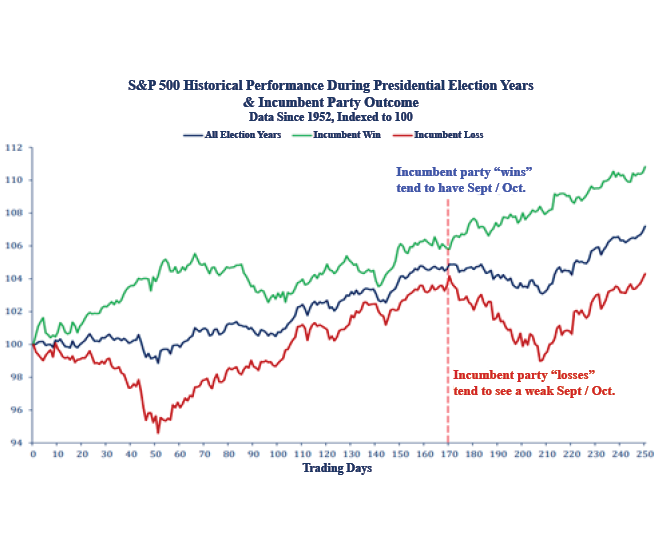
- Politics will dominate the headlines until the November election, and the uncertainty of a close presidential race has historically made for bumpier markets. Our Chart of the Month below reveals equity performance during the two-month lead-up to the election has been strongest when the incumbent party wins. For investors, the makeup of Congress may matter as much or more than who wins the White House.
Insights by John Silvia, Director of Economics

Two fundamentals—one policy and one economic—have altered the outlook for financial markets. First, Chairman Powell’s presentation at Jackson Hole in August shifted policy focus to the labor market and the willingness to conduct policy to limit further deterioration. Second, the employment data has softened over the last three months, suggesting that slower economic growth is ahead.
- In his presentation, Powell stated, “We do not seek or welcome further cooling in labor market conditions.” Over the last three months, private sector job growth has slowed, and job openings were down. The August unemployment rate, at 4.2%, remains above the rate of three months ago. The employment data supports the case for a Fed rate cut in September and November, depending on the forthcoming economic data.
- While the Fed has focused on rebalancing the labor market, the overall flow of economic data supports the outlook for a slowdown, not a recession.
- Jobless claims remain low, and the ISM services survey rose above breakeven along with the orders and employment components.
- Even more so for the markets, the Fed’s benchmark core PCE deflator for July came in at 1.7% over the last three months, compared to a rise of 2.6% over the last 12 months. This progress opens the door for a Fed easing move in September.
- One problem that appeared was the rise of inflation expectations in the preliminary consumer sentiment survey in August. One-year inflation expectations were 2.9%; two-year inflation expectations were 2.5%, according to the Federal Reserve Bank of Cleveland. Both measures are significantly above the 2% inflation target set by the Federal Reserve.
- For investors, the persistence of inflation indicates that the extent of Fed easing will be less than what the market is discounting after December.
- For all of 2024, our expectation for 2.3% economic growth has not changed, which has provided a solid guidepost on the strength of the economy. Positive contributions to growth are broad-based and come from consumer spending, business investment and government. Trade, however, has been a drag on growth as imports exceed exports.
- Two inflation indicators we have followed also support reduced inflation pressures ahead. However, the decline in those inflation pressures remains limited and does not support a string of policy easing after December. The Federal Reserve Bank of Dallas trimmed mean measure of inflation has dropped to 2.7%. Second, the price pressures measure published by the St. Louis Fed for July assigns a high probability that the PCE deflator will be above 2.5% a year from now. These two measures corroborate the view of a possible but limited Fed easing in the year ahead.
- Expectations for growth, inflation and interest rates continue to favor investors. For the economy, the recent job gains over the last three months are positive. Inflation concerns have declined, and expectations of a Fed rate cut in September have increased. The result now is that our three economic factors have set a positive tone for financial markets. Therefore, we suspect the degree of the recent decline in equity prices and the decline in bond yields is overdone relative to the economic fundamentals.
- Profits have been the big positive surprise for investors and have supported equity valuations despite no Fed rate cuts. Pre-tax corporate profits bottomed out in Q4 2022 and are up 11.7% year-over-year as of Q2. Strength in real final sales and improved productivity have lowered employment costs and boosted profits above market expectations.
- Recent expectations of Fed easing have led to a modest decline in the value of the U. S. dollar compared to a month ago. As expectations for lower growth and Fed easing emerged, the dollar declined.
- On the global front, the initial disappointing China reopening has led to ongoing pessimism. Incidents of financial and commercial real estate weakness continue to moderate the economic outlook for China. Caution is still the watchword here as well.
- Expectations for economic growth in Europe and Japan continue to be below 1% for the year ahead. Consensus estimates for Canadian and U.K. growth have improved to 1% this year.
- The central theme in our outlook remains. U.S. financial markets continue to adjust to the economic reality of better-than-trend economic growth, higher-for-longer interest rates (above the averages of the 2012-2019 period), and recently improved profit expectations. These factors support a more positive but cautious view of financial asset valuations relative to 2023.
Quote of the Month
“The single greatest edge an investor can have is a long-term orientation.”
— Seth Klarman, American investor, hedge fund manager, and author.
Chart of the Month
The information published herein is provided for informational purposes only, and does not constitute an offer, solicitation or recommendation to sell or an offer to buy securities, investment products or investment advisory services. All information, views, opinions and estimates are subject to change or correction without notice. Nothing contained herein constitutes financial, legal, tax, or other advice. The appropriateness of an investment or strategy will depend on an investor’s circumstances and objectives. These opinions may not fit to your financial status, risk and return preferences. Investment recommendations may change, and readers are urged to check with their investment advisors before making any investment decisions. Information provided is based on public information, by sources believed to be reliable but we cannot attest to its accuracy. Estimates of future performance are based on assumptions that may not be realized. Past performance is not necessarily indicative of future returns. The following indexes were used as proxies in the performance tables: Global Stocks = MSCI ACWI; U.S. Large Cap = S&P 500; U.S. Large Value = Russell 1000 Value; U.S. Large Growth = Russell 1000 Growth; U.S. Small Cap = Russell 2000; Int’l Dev Stocks = MSCI EAFE; Emerging Markets = MSCI EM; U.S. Inv Grade Bonds = Barclays U.S. Aggregate; U.S. High Yield Bonds = Barclays Corporate High Yield; Emerging Markets Debt = JPMorgan EMBI Global Diversified; Int’l Bonds = Barclays Global Treasury ex US; Cash = 3month T-Bill; Sector returns displayed in the chart represent S&P 500 sectors, while treasury benchmarks are from Barclays
Source: Schwab Center for Financial Research with data provided by Morningstar, Inc., as of 3/31/2022. Asset class performance represented by annual total returns for the following indexes: S&P 500® Index (US Lg Cap), Russell 2000® Index (US Sm Cap), MSCI EAFE® Net of Taxes (Int’l Dev), MSCI Emerging Markets IndexSM (EM), MSCI US REIT Index (REITs), S&P GSCI® (Comm.), Bloomberg Barclays U.S. Treasury Inflation-Linked Bond Index (TIPS), Bloomberg Barclays U.S. Aggregate Bond Index (Core US Bonds), Bloomberg Barclays U.S. High Yield Bond Index (High Yield Bonds), Bloomberg Barclays Global Aggregate Ex-USD TR Index (Int’l Dev Bonds), Bloomberg Barclays Emerging Markets USD Bond TR Index (EM Bonds), FTSE U.S. 3-Month T-Bill Index (T-Bills). Past results are not an indication or guarantee of future performance. Returns assume reinvestment of dividends, interest, and capital gains. Indexes are unmanaged, do not incur fees or expenses, and cannot be invested in directly.
Chart of the Month: Strategas
Chart of the Month
Quote of the Month
“The single greatest edge an investor can have is a long-term orientation.”
— Seth Klarman, American investor, hedge fund manager, and author.
Trailing Returns