Market Perspectives August 2024
Capital Markets
By: Wade Austin
July was characterized by a notable shift in market dynamics in response to evolving economic indicators and expectations. The month began with a focus on cooling inflation and expectations of impending interest rate cuts, which propelled a rally in growth stocks and technology-heavy indices. However, the market narrative took a turn in the second half as investors rotated into value stocks and cyclical sectors, particularly small-cap equities.
Here’s a breakdown of the key themes:
Equity Markets:
- U.S. large-cap stocks extended their 1H rally into early July. The S&P 500 peaked at 5,667 on July 16, up 19.6% YTD on a total return basis.
- However, a lot changed in a few short weeks. Despite the rotation out of large-cap growth stocks, most prominently the “Magnificent 7” tech stocks, the S&P 500 still managed a 1.2% gain for the month.
- Market breadth increased during July as “the other 493” S&P 500 constituents gained momentum. Nine of 11 major sectors advanced, led by real estate, up 7.2%. Communication services (-4.0%) was the laggard.
- After trailing for the prior 12 months, value stocks continued to climb higher in the second half when growth stocks faltered. Value stocks finished well (+5.1%) for July while their growth counterparts slipped (-1.7%).
- The biggest beneficiary of the rotation was small-cap stocks after odds for a September Fed rate cut spiked to nearly 100%. Smaller companies have struggled to grow profits in the higher-for-longer interest rate environment. The S&P 500, DJIA and NASDAQ recovered from 2022’s bear market, first reaching new all-time highs last December and January. However, the Russell 2000 small-cap index ended June a whopping 16.2% below its all-time high, reached Nov. 8, 2021. After surging 10.2% in July, the Russell 2000 remained 7.7% off its previous high value.
- Developed international stocks (+2.9%) outgained the U.S. in July, while EM equities advanced fractionally (+0.3%).
Bond Markets:
- U.S. Treasury yields fell across the curve, delivering solid monthly gains for U.S. bonds. With the benchmark 10-year Treasury note dropping from 4.4% to 4.0% in July, the U.S. Bloomberg Bond Index logged a 2.3% total return.
- All major U.S. fixed income sectors posted solid gains, led by investment-grade corporate bonds (+2.4%). Municipal bonds were the laggard in July but still returned +0.9%.
- Investors traditionally consider widening high yield corporate bond spreads a “canary in the coal mine” early warning sign of impending economic turbulence. Notably, high yield bonds returned +1.9% in July, as their spreads against “safe haven” U.S. Treasurys widened only modestly.
Key Takeaways:
- Volatility returned with a vengeance over the first three trading days of August. On Aug. 5, the Volatility Index (VIX), considered the U.S. equity market’s “fear gauge,” recorded its second-largest one-day increase ever.
- Renewed recession fears returned after disappointing July jobs reports, which prompted an adjustment in the timing and magnitude of U.S. rate cuts. Further contributors to last Monday’s VIX spike included weekend news of Warren Buffett’s cash raise revealed in Berkshire Hathaway’s quarterly earnings report, the triggering of a recession signal called the Sahm Rule, and the unwinding of the highly leveraged Japanese yen carry trade.
- Most investors weren’t familiar or involved in the yen carry trade. As the world’s last central bank to hold interest rates at 0%, some institutional investors (mainly large hedge funds) took advantage by borrowing against the Japanese yen, at virtually no cost, to then invest in risky assets generating attractive returns, such as U.S. equities. When the Bank of Japan finally raised interest rates, those hedge funds were forced to quickly raise cash to avoid a margin call. The algorithmic unwinding of their U.S. equity positions at the same time that other fears had surfaced created the near panic-selling environment. Fortunately, Wall Street reports estimate that the unwinding yen carry trade is mostly complete.
- More broadly, John Silvia, CIC’s director of economics, does not see a recession on the near-term horizon (6 to 9 months) based on his tracking of fundamental economic conditions. He forecasts a slowing, but not tanking, economy—an important distinction for investors. See his commentary below for additional perspective.
- Equities have delivered attractive returns during periods of economic growth. According to a recent study by Goldman Sachs, investors have enjoyed 86% odds of a positive return—and a much greater likelihood of large gains than of large losses—in years when the economy is expanding.
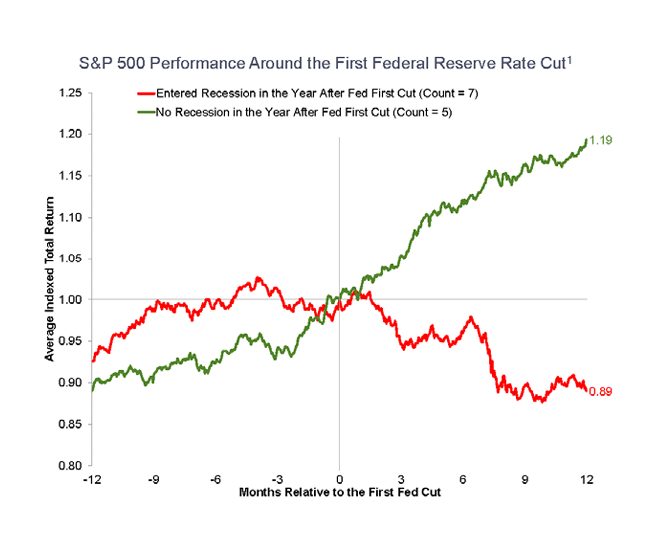
- In the context of the Fed expected to cut rates in September, the recession call is vital to the outlook for stocks. As graphed in our Chart of the Month, the first rate cut has precipitated a binary outcome for the path of stocks. When a recession was avoided, the S&P 500 rose an average of 12% over the next 12 months, compared to an 11% decline during a recession.
Reflections:
- In last month’s Market Perspectives, we cautioned that markets had been on an unusually calm ride and to brace for summer storms. We didn’t necessarily expect a hurricane-type event, but the odds were against finishing 2024 with only a 5% pullback (April).
- While the selloff felt jolting, the S&P 500’s maximum drawdown to date (July 16 – Aug. 5) of -8.5% was quite normal. For perspective, the average max intra-year drawdown over the past 44 years is -14.2%, yet the S&P 500’s annual returns were positive in 33 of those years.
- For broadly diversified investors, the silver lining during those difficult three weeks was that bonds acted like a hedge again. During this same max drawdown period for equities, the Bloomberg U.S. Aggregate Index rose 2.2%.
- VIX spikes (Aug. 5), as well as three consecutive days of hefty losses (as endured Aug. 1, 2, and 5), have both been better buy than sell signals, historically. Similar conditions preceded above-average returns in the next three to 12 months.
- The Paris Olympics were an exhilarating spectacle of intense competition with clear winners and losers. (Congratulations to the U.S. athletes for winning the most medals!) In contrast, the stock market is a continuous race where volatility is the norm. Staying invested doesn’t preclude occasional pullbacks and is typically not a reason to underweight stocks. Strategic investors who had already emphasized diversification and non-correlated assets in constructing their portfolios realize periods of extreme volatility present opportunities for patient capital.
Insights by John Silvia, Director of Economics

In his recent testimony, Chairman Powell of the Federal Reserve said that the Fed “will be data dependent but not data-point dependent.” For investors, this point is an essential principle of thoughtful investing. The latest employment report is a case in point.
- July’s employment report came below market expectations and prompted a jump in recession talk and a selloff in equity indices. However, this one-month decline was associated with a hurricane hitting the Southwest. In the prior cases of Hurricanes Katrina and Ida, employment declined sharply in the month the hurricane hit but bounced back in subsequent months. For investors, data matters, but data points can be misleading.
- On the economy, the Fed has focused on a rebalancing of the labor market. The Fed has witnessed this rebalancing over the last three months, as job openings have declined and private sector job gains in July were below the average of the prior three and 12 months.
- However, the rise in the unemployment rate set off warnings of a recession by equity strategists. We disagree with the recession call.
- Jobless claims remain low, and the ISM services survey, along with the orders and employment components, rose above breakeven.
- On inflation, the Fed cites the average hourly earnings number as a signal of inflation pressures. This measure continues to disappoint. Over the last three months, earnings have been up 3.7%, compared to 3.6% over the last 12 months.
- Even more so for the markets, the Fed’s benchmark core PCE deflator for June came in at 2.3% over the last three months, compared to a rise of 2.6% over the last 12 months. This progress opens the door for a Fed easing move in September.
- One problem that appeared was the rise of inflation expectations in the preliminary consumer sentiment survey in June. One-year inflation expectations were 3.0%. Two-year inflation expectations were 2.5%, according to the Federal Reserve Bank of Cleveland. Both measures are significantly above the 2% inflation target set by the Federal Reserve.
- Our expectation for 2.3% economic growth has not changed for all of 2024 and has provided a solid guidepost on the economy’s strength. Positive contributions to growth are broad-based and come from consumer spending, business investment and government. Trade, however, has been a drag on growth, as imports exceed exports.
- Two inflation indicators we follow also support reduced inflation pressures ahead. However, the decline in those inflation pressures remains limited and does not support a string of policy easing after September. The Federal Reserve Bank of Dallas trimmed mean measure of inflation has dropped to 2.8%. Second, the price pressures measure published by the St. Louis Fed for July assigns a high probability that the PCE deflator will be above 2.5% a year from now. These two measures corroborate the view of a possible, but limited, Fed easing in the year ahead.
- Expectations for growth, inflation and interest rates continue to favor investors. The recent job gains over the last three months are favorable for the economy. Inflation concerns have declined, and expectations of a Fed rate cut in September have increased. The result now is that our three economic factors have set a positive tone for financial markets.
- Profits have been a significant positive surprise for investors and have supported equity valuations in the face of no Fed rate cuts. Pre-tax corporate profits bottomed out in Q4 2022 and are up 10.1% year-over-year, as of Q1. Strength in real final sales and improved productivity have lowered employment costs, which has boosted profits above market expectations.
- The gains in profits reflect better real final sales and improved nonfarm productivity. Productivity was up 2.7% in Q2 from a year ago, while unit labor costs were up only 0.5% compared to a year ago. The gain in productivity lowered employment costs per unit of output and delivered gains in corporate profits.
- On the global front, the initial disappointing China reopening has given way to better prospects. However, incidents of financial and commercial real estate weakness continue to moderate the economic outlook for China. Caution is the watchword here as well.
- Expectations for economic growth in Europe, Japan and the U.K. are all below 1% for the year ahead. Consensus estimates for Canadian growth are expected at 1% for this year.
Quote of the Month
“I don’t think volatility is an altogether irrelevant proxy for risk, even though, to a cool, dispassionate investor with a long-term time horizon, volatility is wonderful.”
— Peter Bernstein, American financial historian, economist, and educator
Chart of the Month
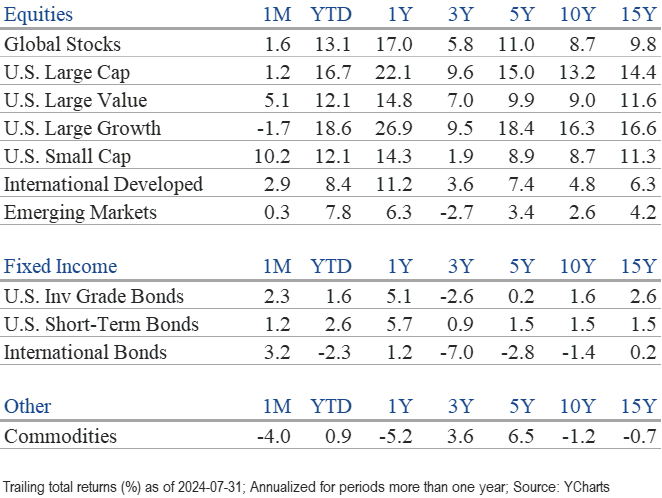
The information published herein is provided for informational purposes only, and does not constitute an offer, solicitation or recommendation to sell or an offer to buy securities, investment products or investment advisory services. All information, views, opinions and estimates are subject to change or correction without notice. Nothing contained herein constitutes financial, legal, tax, or other advice. The appropriateness of an investment or strategy will depend on an investor’s circumstances and objectives. These opinions may not fit to your financial status, risk and return preferences. Investment recommendations may change, and readers are urged to check with their investment advisors before making any investment decisions. Information provided is based on public information, by sources believed to be reliable but we cannot attest to its accuracy. Estimates of future performance are based on assumptions that may not be realized. Past performance is not necessarily indicative of future returns. The following indexes were used as proxies in the performance tables: Global Stocks = MSCI ACWI; U.S. Large Cap = S&P 500; U.S. Large Value = Russell 1000 Value; U.S. Large Growth = Russell 1000 Growth; U.S. Small Cap = Russell 2000; Int’l Dev Stocks = MSCI EAFE; Emerging Markets = MSCI EM; U.S. Inv Grade Bonds = Barclays U.S. Aggregate; U.S. High Yield Bonds = Barclays Corporate High Yield; Emerging Markets Debt = JPMorgan EMBI Global Diversified; Int’l Bonds = Barclays Global Treasury ex US; Cash = 3month T-Bill; Sector returns displayed in the chart represent S&P 500 sectors, while treasury benchmarks are from Barclays
Source: Schwab Center for Financial Research with data provided by Morningstar, Inc., as of 3/31/2022. Asset class performance represented by annual total returns for the following indexes: S&P 500® Index (US Lg Cap), Russell 2000® Index (US Sm Cap), MSCI EAFE® Net of Taxes (Int’l Dev), MSCI Emerging Markets IndexSM (EM), MSCI US REIT Index (REITs), S&P GSCI® (Comm.), Bloomberg Barclays U.S. Treasury Inflation-Linked Bond Index (TIPS), Bloomberg Barclays U.S. Aggregate Bond Index (Core US Bonds), Bloomberg Barclays U.S. High Yield Bond Index (High Yield Bonds), Bloomberg Barclays Global Aggregate Ex-USD TR Index (Int’l Dev Bonds), Bloomberg Barclays Emerging Markets USD Bond TR Index (EM Bonds), FTSE U.S. 3-Month T-Bill Index (T-Bills). Past results are not an indication or guarantee of future performance. Returns assume reinvestment of dividends, interest, and capital gains. Indexes are unmanaged, do not incur fees or expenses, and cannot be invested in directly.
Chart of the Month: Goldman Sachs Investment Strategy Group, Bloomberg
Chart of the Month
Quote of the Month
“I don’t think volatility is an altogether irrelevant proxy for risk, even though, to a cool, dispassionate investor with a long-term time horizon, volatility is wonderful.”
— Peter Bernstein, American financial historian, economist, and educator
Trailing Returns