Market Perspectives July 2024
Capital Markets
By: Wade Austin
Equities climbed to close out the first half of the year as inflation slowly moderated; economic data softened but remained healthy; and bond yields fluctuated within a relatively narrow range. Here’s a breakdown of the key themes:
Equity Markets:
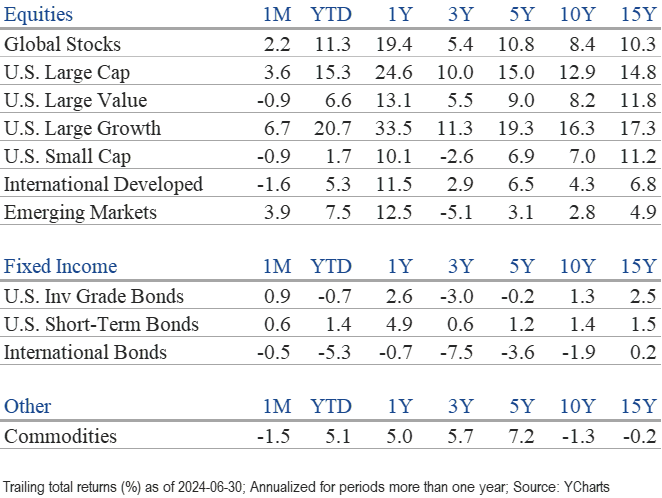
- U.S. large-cap stocks, particularly mega-cap tech companies, were the primary engine driving global equities higher. The S&P 500 gained 3.6%; the tech-heavy Nasdaq 100 surged 6.3%; and the Dow Jones gained a modest 1.2%. Boosted by India’s surging economy and impressive 7% monthly return, Emerging markets’ 3.9% pop led global markets, while developed international stocks declined 1.6%.
- The broad U.S. stock index rose in Q2, propelling the S&P 500’s 1H return to a stellar 15.3%. Emerging markets (+7.5%) and international developed stocks (+5.3%) also produced solid YTD gains, although a strong U.S. dollar muted their dollar-denominated returns.
- On the surface, U.S. economic and stock market growth appeared relentless and drama-free. While the S&P 500 reached 5,487 on June 18 (its 31st all-time high this year) and the Nasdaq first reached the 18,000-point milestone on June 28, a rising tide has not lifted all boats. Large-cap value stocks generally moved in the opposite direction in June, down -0.9%, and less than half of the major sectors (5 of 11) registered gains in June. The top performer was Technology, up 9.3%, while Utilities was the laggard, down -5.5%. YTD through June, large-cap growth stocks have outperformed large-cap value stocks by a whopping 14.1 percentage points.
- Small-cap stocks have struggled mightily during this period of elevated interest rates. The Russell 2000 index dropped -0.9% in June and barely maintained a positive 1H return, up +1.7%. Not only have they failed to keep pace with large-caps, but the Russell 2000 index sits 16.2% below its last all-time high set on Nov. 8, 2021.
Bond Markets:
- The Fed held its target lending rate steady during Q2, choosing to wait for more evidence that inflation is on a sustainable path towards its 2% target.
- Treasury yields declined modestly in June, despite the unemployment rate inching up to 4%. The yield on the 10-year Treasury note closed on June 28 at 4.4%, well above the 3.88% mark beginning this year. While below last October’s high of 4.99%, the benchmark yield sits 201 basis points above its latest 10-year average of 2.39%.
- The Bloomberg U.S. Aggregate Bond Index rose 0.9% in June, although it was up only fractionally for the quarter and down -0.7% for the year.
- Given the surprising resilience of the U.S. economy, high-yield corporate bonds have been the best-performing fixed income sector over the last month (+0.94%), quarter (+1.1%), and 1H (+2.58%).
Key Takeaways:
- Investors shrugged off concerns about the U.S. deficit, surging federal debt, and rich large-cap stock valuations. Instead, they’ve prioritized the positives: respectable earnings growth, relatively low long-term interest rates, and tight credit spreads. The continued outperformance of growth over value seems to strengthen that view.
- The generative AI boom has been the primary catalyst for U.S. economic dominance over the rest of the world by promising to improve efficiency, productivity, and quality of life for individuals and communities. Corporate R&D investments are creating giant profits for the infrastructure sellers while requiring massive investments for the buyers. Last quarter, five companies (Amazon, Alphabet, Meta, Microsoft, and Nvidia) posted a collective earnings growth of 64%. The remaining 495 S&P 500 constituents reported a -6% decline in earnings. The Magnificent 7 (these five companies plus Apple and Tesla) amassed an aggregate 1H return of 33% and accounted for 61% of the S&P 500’s YTD return.
- Nvidia alone accounts for 4.4% of the S&P 500’s 15.3% YTD gain and briefly, in June, overtook Microsoft to become the world’s largest company by market capitalization. Nvidia’s 5-year return leading up to its June peak was 3,440%. Interestingly, Cisco Systems experienced a similar meteoric rise during the dot-com bubble era. Its 5-year return leading to its March 2000 peak was even greater, up +3,590%. It also briefly eclipsed Microsoft as the world’s largest company. In the 24+ years since its peak, Cisco’s stock price has declined -40.8% despite being consistently profitable. Over that same period, the S&P 500 rose 258%. While there don’t appear to be imminent threats to Nvidia’s current technological superiority, Cisco’s challenges in maintaining its record earnings growth trajectory will eventually become relevant when Nvidia’s competitive moat narrows.
- The U.S. bond market has been in a drawdown period for the past 47 months, by far its longest bear market on record. Its previous most prolonged period to reach a new all-time high was just 16 months. However, as Warren Buffet effectively articulates in our Quote of the Month, the challenge with investing is not making judgments based solely on past performance. With the yield on the 10-year U.S. T-note two full percentage points above its 10-year average and the Fed expected to begin a rate-cutting cycle as early as September, interest rate risks for bonds appear to be skewed in a favorable direction moving forward.
Reflections:
- A consequential factor for the surprisingly robust U.S. consumer spending these past two years is that most Americans have been immune to higher rates. The percentage of U.S. homeowners without a mortgage has risen from 33% to 39% over the past 12 years. Of those households with a mortgage, only 11% have an adjustable interest rate. Consequently, the vast majority who carry mortgages, car loans, and student loans have yet to be negatively impacted by the Fed’s 11 rate hikes.
- After the dot-com bubble burst in 2000, the Nasdaq Composite took 17 years to rise from 5,000 to 6,000. In just the past seven years, the index has climbed 12 more 1,000-point milestones!
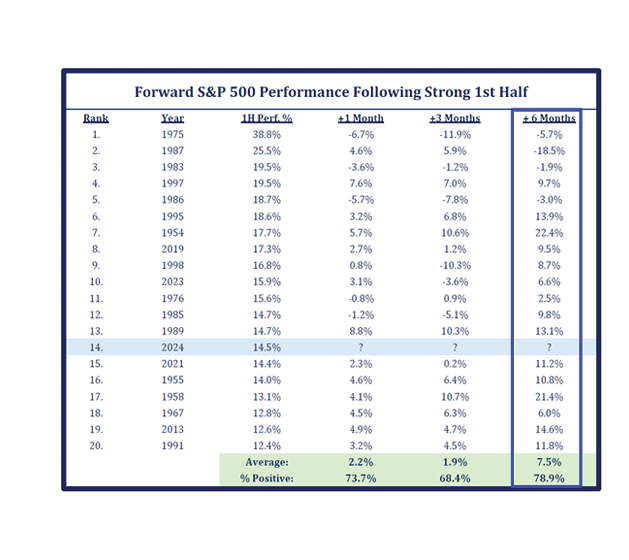
- Momentum and trend are potent forces in markets. In our April Chart of the Month, we noted that a strong Q1 for the S&P 500 typically bodes well for the rest of the year. After immediately suffering a -5% drawdown in April, the S&P 500 rallied in both May and June to post a 4.3% gain for Q2. In our July Chart of the Month, we examine how the market performs after a particularly strong 1H. 2024 has delighted with the 14th best performance since 1950. After the other 19 fastest starts, July averaged a +2.2% return with a 73.7% batting average. The entire 2H averaged +7.5% returns with a 78.9% positive hit rate.
- July’s seasonality has historically been a tailwind for markets and is even more likely during presidential re-election years. As campaign seasons heat up, an incumbent president (regardless of party) uses his powers to stimulate consumer spending and ensure a strong economy on election day. With only four months to go, the tools that this administration has utilized include the Strategic Petroleum Reserve, student loan forgiveness, restarting the Employee Retention Tax Credit, and granting statutory authority for Freddie Mac to buy home equity loans.
- Summer storms are an accepted occurrence in the Carolinas and should be in the stock market as well. Over the past 50 years, the S&P 500 has averaged seven -1.0% or worse days during the June-August period. During the sell-off of Summer 2022, the S&P 500 suffered 13 down days of -1% or more. Yet, the June start to this summer was the calmest month in the past five years. The S&P 500’s worst day was -0.41%. The index may finish higher by August’s end, but we don’t expect this season to be entirely immune from volatility.
Insights by John Silvia, Director of Economics
 For some time now, the Fed has asserted that it is data-dependent. Over the last two months, the economic data has delivered evidence to support a Fed easing of policy in September.
- On the economy, the Fed has focused on the labor market, and the latest monthly jobs report may be just what the Fed needed. Private sector job gains in June were below the average of the prior three and 12 months. Average hourly earnings slowed compared to a year ago, and the unemployment rate rose.
- On inflation, the Fed cites the average hourly earnings number as a signal of inflation pressures. Even more so for the markets, the Fed’s benchmark core PCE deflator for May came in at 2.7% and is on a path of moderation consistent with reaching the Fed’s 2% target sometime in 2025.
- One problem that appeared was the rise of inflation expectations in the preliminary consumer sentiment survey in May. One-year inflation expectations were 3.5% in May, compared to 3.0% three months ago. Five-year inflation expectations were 3.1% in May, compared to 2.9% three months ago.
- For all of 2024, our expectation for 2.3% economic growth has not changed. Positive contributions to growth are broad-based and come from consumer spending, business investment, and government. Trade, however, will be a drag on growth as imports exceed exports.
- Two inflation indicators we follow also support reduced inflation pressures ahead. First, the Federal Reserve Bank of Dallas trimmed mean measure of inflation has dropped to 2.8%. Second, the price pressures measure published by the St. Louis Fed for June assigns a lower probability that the PCE deflator will be above 2.5% a year from now. These two measures corroborate the view of a possible, if limited, Fed easing in the year ahead.
- Expectations for growth, inflation, and interest rates continue to favor investors. For the economy, the recent job gains are positive. Inflation concerns have declined, and fear of a Federal Reserve rate increase has evaporated and now instead favors an easing. The result is that our three economic factors have set a positive tone for financial markets.
- Profits have been a big positive surprise for investors and have supported equity valuations in the face of no Fed rate cuts. Pre-tax corporate profits bottomed out in Q4 2022 and are up 6.4% year-over-year as of Q1. Strength in real final sales, along with improved productivity that has lowered employment costs, has boosted profits above market expectations.
- The gains in profits reflect better real final sales. Nonfarm productivity was up +2.9% in Q1 2024 compared to being down -0.5% in Q1 2023. The gain in productivity lowered employment costs per unit of output. The employment cost index was up +4.3% as of Q1 2024 compared to +5.1% as of Q1 2023.
- Recent expectations of Fed easing have led to a modest decline in the value of the U.S. dollar compared to a month ago. Over the last year, the dollar has been up to reflect gains in economic growth expectations, limited Fed rate cuts, and relative economic strength compared to our trading partners.
- One central theme in our outlook remains. U.S. financial markets continue to adjust to the economic reality of better-than-expected economic growth, higher-for-longer interest rates, and recently improved profit expectations. These factors support a more positive but cautious view of financial asset valuations relative to the challenges of 2022 and the first half of 2023.
- On the global front, the initial disappointing China reopening has given way to better prospects. However, incidents of financial and commercial real estate weakness continue to moderate the economic outlook for China.
- Expectations for economic growth in Europe, Japan, and the U.K. remain below 1% for the year ahead. Consensus estimates for Canadian growth are now expected at 1% for this year. Stronger capital inflows into the U.S. have boosted the dollar, increased equity valuations, and limited the rise in Treasury interest rates.
Quote of the Month
“If past history was all that is needed to play the game of money, the richest people would be librarians.”
— Warren Buffet, legendary American businessman, investor, and philanthropist
Chart of the Month
The information published herein is provided for informational purposes only, and does not constitute an offer, solicitation or recommendation to sell or an offer to buy securities, investment products or investment advisory services. All information, views, opinions and estimates are subject to change or correction without notice. Nothing contained herein constitutes financial, legal, tax, or other advice. The appropriateness of an investment or strategy will depend on an investor’s circumstances and objectives. These opinions may not fit to your financial status, risk and return preferences. Investment recommendations may change, and readers are urged to check with their investment advisors before making any investment decisions. Information provided is based on public information, by sources believed to be reliable but we cannot attest to its accuracy. Estimates of future performance are based on assumptions that may not be realized. Past performance is not necessarily indicative of future returns. The following indexes were used as proxies in the performance tables: Global Stocks = MSCI ACWI; U.S. Large Cap = S&P 500; U.S. Large Value = Russell 1000 Value; U.S. Large Growth = Russell 1000 Growth; U.S. Small Cap = Russell 2000; Int’l Dev Stocks = MSCI EAFE; Emerging Markets = MSCI EM; U.S. Inv Grade Bonds = Barclays U.S. Aggregate; U.S. High Yield Bonds = Barclays Corporate High Yield; Emerging Markets Debt = JPMorgan EMBI Global Diversified; Int’l Bonds = Barclays Global Treasury ex US; Cash = 3month T-Bill; Sector returns displayed in the chart represent S&P 500 sectors, while treasury benchmarks are from Barclays
Source: Schwab Center for Financial Research with data provided by Morningstar, Inc., as of 3/31/2022. Asset class performance represented by annual total returns for the following indexes: S&P 500® Index (US Lg Cap), Russell 2000® Index (US Sm Cap), MSCI EAFE® Net of Taxes (Int’l Dev), MSCI Emerging Markets IndexSM (EM), MSCI US REIT Index (REITs), S&P GSCI® (Comm.), Bloomberg Barclays U.S. Treasury Inflation-Linked Bond Index (TIPS), Bloomberg Barclays U.S. Aggregate Bond Index (Core US Bonds), Bloomberg Barclays U.S. High Yield Bond Index (High Yield Bonds), Bloomberg Barclays Global Aggregate Ex-USD TR Index (Int’l Dev Bonds), Bloomberg Barclays Emerging Markets USD Bond TR Index (EM Bonds), FTSE U.S. 3-Month T-Bill Index (T-Bills). Past results are not an indication or guarantee of future performance. Returns assume reinvestment of dividends, interest, and capital gains. Indexes are unmanaged, do not incur fees or expenses, and cannot be invested in directly.
Chart of the Month: Strategas
Chart of the Month
Quote of the Month
“If past history was all that is needed to play the game of money, the richest people would be librarians.”
— Warren Buffet, legendary American businessman, investor, and philanthropist
Trailing Returns