Market Perspectives October 2024
Capital Markets
By: Wade Austin
In September, capital markets experienced a mix of cautious optimism and heightened volatility as investors navigated through key economic data, central bank policy updates, and geopolitical tensions. Here’s a breakdown of the key themes:
Equity Markets:
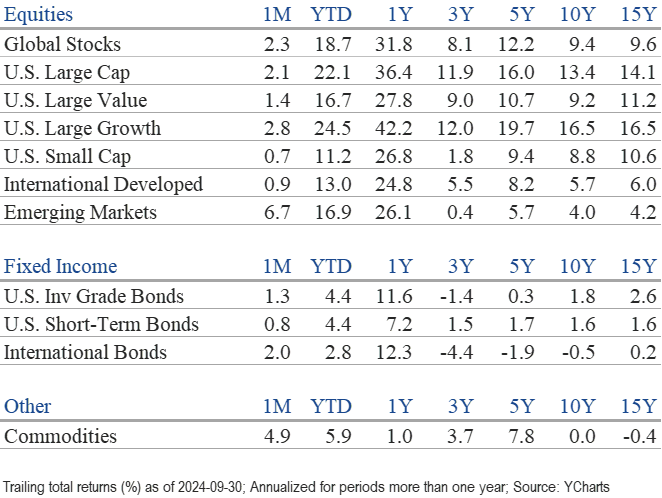
- Stocks fell in the first week of September but gained strength leading up to and following the FOMC meeting on Sept. 18. The S&P 500 rose 2.1% in September, the Dow Jones Industrial Average advanced 2%, and the Nasdaq Composite added 2.8%. Emerging markets were a big beneficiary of the monetary policy easing, jumping by 6.7% last month.
- The S&P 500 hit a new all-time high on Sept. 30, closing at 5,762. The large-cap index has reached all-time highs in seven of the first nine months of 2024 (April and August did not). Its September YTD gain of 22.1% is the best-ever start to an election year.
- The S&P 500 posted its fifth consecutive monthly gain in September, up 10 of the last 11 months (April declined). After the previous 29 five-month winning streaks, the index was higher a year later 28 times.
- Value stocks outperformed growth stocks across the board in Q3 (9.4% vs. 3.2%), although growth beat value in September (2.8% vs. 1.4%).
- International (+7.8%) and emerging market stocks (+8.7%) rallied and outperformed U.S. stocks (5.9%) for the quarter. Unexpected stimulus from the Chinese government sent China’s index soaring, up 23.9% in September.
- With expectations for a September rate cut accelerating mid-summer, small-cap stocks and public real estate (REITs) were the biggest beneficiaries, gaining 9.3% and 16.5% in Q3.
Bond Markets:
- In anticipation of the Federal Reserve’s widely expected September rate cut, Treasury yields fell across the curve, with shorter-term durations posting large declines. The 1-mo., 3-mo., and 6-mo. T-Bills all fell around 50 basis points, reflecting the Fed’s aggressive half percentage point rate cut. The 10-year percentage fell a tenth of a percentage point to 3.7%.
- Bond funds benefited from the Fed’s actions and declining yields. Each major U.S. fixed income sector posted positive returns for both the month and the quarter.
- The Bloomberg U.S. Aggregate Bond Index returned 1.34% in September and a hefty 5.2% in Q3. U.S. Investment Grade Corporate Bonds fared better than Treasurys, returning 1.77% for the month and 5.84% for the quarter.
- High-yield credit spreads were volatile but ended the quarter tighter amid signs of economic resilience. High yield corporates posted a 1.62% return for the month and 5.28% for the quarter. Municipal bonds lagged but produced positive returns of 0.99% in September and 2.71% in Q3.
Key Takeaways:
- During Q3, markets dealt with multiple external shocks, including turmoil in the Middle East, two assassination attempts on former President Trump, President Biden exiting the 2024 election race, a major dockworkers strike, and a devasting hurricane. While the stock market looked past these concerns, there was a notable shift within. The more defensive sectors of the U.S. stock market, such as utilities, industrials and healthcare, led during Q3—a significant change from the previous couple of years, which were dominated by the strength of the Magnificent 7 technology stocks.
- After pausing its hiking cycle in July 2023, the Federal Reserve cut interest rates by 50 basis points on Sept. 18, despite the S&P 500 being near its all-time high. Using history as a guide is helpful in identifying how fixed income and equity markets may react to the Fed’s first rate cut since 2020.
- Bond prices and returns are very sensitive to Fed easing cycles, given that bond prices move inversely to rates. Unsurprisingly, the Bloomberg U.S. Treasury Total Return Index performance was positive in all easing cycles since 1972 over the following 3-, 6-, 9-, and 12-month periods—whether the economy went into a recession or not.
- When the Fed cut rates during soft landings (our base case), approximately 70% of the drop in 10-year yield happens before the first cut. Conversely, approximately 70% of the decline in yield occurred after the first cut if the economy entered a recession. In the current case, the Agg returned a whopping 14.5% in the six months leading up to Sept. 18.
- As shared in our August Market Perspectives, the forward path for the stock market primarily hinges on whether the U.S. economy enters a recession in the 12 months after the Fed’s first rate cut. The encouraging news is that our Director of Economics, John Silvia, is not forecasting a recession in the near term. In another bullish signal, the previous 20 times that the Fed cut rates when the S&P 500 was within 2% of an all-time high, the index was higher 12-months forward all 20 times, with an average return of 13.9%.
Reflections:
- This bull market hits its 2-year birthday on Oct. 12, having already gained 61%. How does this compare to prior bull markets? Since 1950, the average bull has lasted 5.5 years and gains 180.7%. Of those 10 bull markets that reached 2 years, 70% extended to celebrate a 3-year birthday. However, year 3 performance was mixed.
- The S&P 500 has averaged a 7.8% return since 1928, but some investors become overly cautious when the stock market is having a great year. However, when the S&P 500 is higher for the calendar year, big gains are perfectly normal. The average return during up years is 19%, while down years average -13.9%. These results reinforce the data we shared in our February Market Perspectives, which shows that forward returns are better when investing at new high days than any other day.
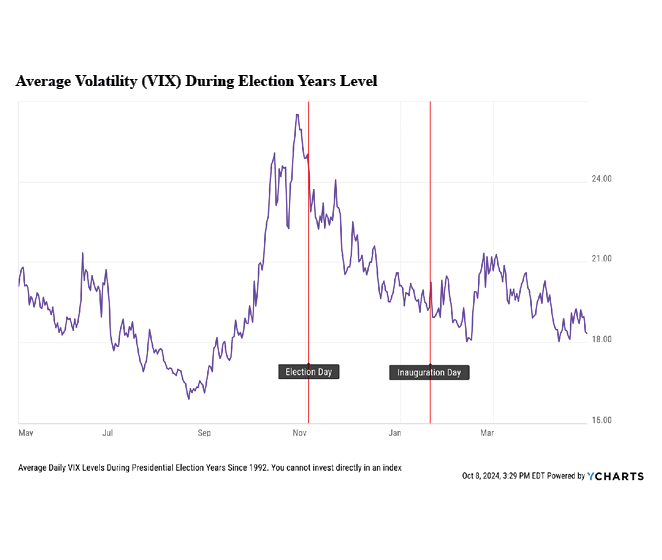
- Based on a recent study by Research Affiliates of presidential elections’ impact on the stock market, stocks tend to fall in the run-up to a close election. They often surge the week before the election. Researchers concluded that both sides feared the outcome ahead of the election, resulting in a risk-off period. Once the outcome appears less in doubt (often the week before the election), the stock market usually rebounds as investor anxiety dissipates on one side of the aisle.
- Our October Chart of the Month confirms Research Affiliates’ thesis. Based on the previous eight election cycles, average volatility (measured by the Volatility Index, “VIX”) rose in the two months before election day. However, the VIX often cooled between Election Day and Inauguration Day. To date, markets have been choppy, but we would not be surprised if volatility trended higher this month.
Insights by John Silvia, Director of Economics

Investors’ expectations for the pace of economic growth and monetary policy easing have shifted. A stronger-than-expected labor market report on Friday, Oct. 4, raised growth expectations and lowered Fed easing expectations.
- Since Federal Reserve Chairman Powell’s presentation at Jackson Hole, expectations have become sensitive to labor market developments.
- Three data points from the employment report were significant. First, the pace of job gains improved. September private sector jobs were up 223,000 which is above the last 3- and 12- months’ pace. Second, the unemployment rate fell to 4.1%, which is significantly below the Fed’s expectation of a higher unemployment rate of 4.4% for the end of 2024. Third, average hourly earnings rose at a 4.3% pace over the last three months, above the 4.0% pace of the last 12 months.
- Stronger employment data indicates more robust overall economic growth and consumer incomes and spending. Real personal consumption spending rose 2.6% during the last three months. During Q2, GDP grew 3%, while consumer spending contributed over 2% to that gain. In addition, all three sectors contributed to economic growth: consumer, business investment, and government.
- Three signals provide corroboration to support the case for a stronger labor market and consumer spending. First, jobless claims remain low and below the level of a month ago. Second, job openings rose in August and were revised upward in July. Third, the employment component of the September ISM services survey rose above Q2’s level.
- For the capital investment sector, capital goods, non-defense orders, ex-aircraft, and shipments were slightly below the level of June. Orders and shipments remain up on a year-over-year basis. Unfilled orders in September were below June and down year-over-year. This signals that the backlog on orders continues to decline and that supply chains are returning to neutral.
- On inflation, the Fed cites the average hourly earnings number as a signal of inflation pressures. This measure continues to disappoint. Over the last three months, earnings have been up 4.3% compared to 4.0% in the previous 12 months.
- Household inflation expectations remain above the Fed’s target 2% rate. The latest University of Michigan one-year inflation expectations are at 2.7%, while the five-year expectations are at 3.1%. For investors with a long-term horizon, 3% inflation will serve as a benchmark for building a portfolio.
- For investors, the persistence of inflation indicates that the extent of Fed easing will be less than what the market is discounting after December.
- For all of 2024, our expectation for 2.3% economic growth has not changed, which has provided a solid guidepost on the economy’s strength. Positive contributions to growth are broad-based and come from consumer spending, business investment, and government. Trade, however, has been a drag on growth as imports exceed exports.
- As for interest rates, expectations of stronger growth and 3% inflation have limited the extent of any decline in long-term rates. Meanwhile, expectations of continued Fed easing have lowered short-term rates. As a result, the yield curve has returned to a slightly positive slope with long rates higher than short rates since the start of September.
- A positively sloped yield curve signals a better economy ahead and is associated with a greater willingness of banks and non-banks to lend credit.
- Expectations for growth, inflation, and interest rates continue to favor investors. The recent job gains are favorable for the economy. Inflation concerns remain, however, and expectations of a Fed rate cut in November (but at a smaller magnitude) also remain.
- Profits have been a significant positive surprise for investors and have supported equity valuations despite no Fed rate cuts in the first half of 2024. Pre-tax corporate profits bottomed out in Q4 2022 and are up 13.6% year-over-year as of Q2. Strength in real final sales and improved productivity, which has lowered employment costs, have boosted profits above market expectations and, thereby, equity valuations.
- For the U.S. dollar, a reversal in the labor market data has led to an uptick in economic growth expectations and a downshift in the extent of Fed easing. However, significant Fed easing is still priced into the dollar’s relative value.
- Expectations for economic growth in Europe and Japan continue to be below 1% for the year ahead. Consensus estimates for Canadian and U.K. growth have improved to 1% for 2024.
- The central theme in our outlook remains. U.S. financial markets continue to adjust to the economic reality of better-than-trend economic growth, higher-for-longer interest rates (above the averages of the 2012-2019 period), and recently improved profit expectations. These factors support a more positive but cautious view of financial asset valuations relative to 2023.
Quote of the Month
“October. This is one of the peculiarly dangerous months to speculate in stocks. The others are July, January, September, April, November, May, March, June, December, August, and February.”
— Mark Twain, American writer, humorist, and essayist
Chart of the Month
The information published herein is provided for informational purposes only, and does not constitute an offer, solicitation or recommendation to sell or an offer to buy securities, investment products or investment advisory services. All information, views, opinions and estimates are subject to change or correction without notice. Nothing contained herein constitutes financial, legal, tax, or other advice. The appropriateness of an investment or strategy will depend on an investor’s circumstances and objectives. These opinions may not fit to your financial status, risk and return preferences. Investment recommendations may change, and readers are urged to check with their investment advisors before making any investment decisions. Information provided is based on public information, by sources believed to be reliable but we cannot attest to its accuracy. Estimates of future performance are based on assumptions that may not be realized. Past performance is not necessarily indicative of future returns. The following indexes were used as proxies in the performance tables: Global Stocks = MSCI ACWI; U.S. Large Cap = S&P 500; U.S. Large Value = Russell 1000 Value; U.S. Large Growth = Russell 1000 Growth; U.S. Small Cap = Russell 2000; Int’l Dev Stocks = MSCI EAFE; Emerging Markets = MSCI EM; U.S. Inv Grade Bonds = Barclays U.S. Aggregate; U.S. High Yield Bonds = Barclays Corporate High Yield; Emerging Markets Debt = JPMorgan EMBI Global Diversified; Int’l Bonds = Barclays Global Treasury ex US; Cash = 3month T-Bill; Sector returns displayed in the chart represent S&P 500 sectors, while treasury benchmarks are from Barclays
Source: Schwab Center for Financial Research with data provided by Morningstar, Inc., as of 3/31/2022. Asset class performance represented by annual total returns for the following indexes: S&P 500® Index (US Lg Cap), Russell 2000® Index (US Sm Cap), MSCI EAFE® Net of Taxes (Int’l Dev), MSCI Emerging Markets IndexSM (EM), MSCI US REIT Index (REITs), S&P GSCI® (Comm.), Bloomberg Barclays U.S. Treasury Inflation-Linked Bond Index (TIPS), Bloomberg Barclays U.S. Aggregate Bond Index (Core US Bonds), Bloomberg Barclays U.S. High Yield Bond Index (High Yield Bonds), Bloomberg Barclays Global Aggregate Ex-USD TR Index (Int’l Dev Bonds), Bloomberg Barclays Emerging Markets USD Bond TR Index (EM Bonds), FTSE U.S. 3-Month T-Bill Index (T-Bills). Past results are not an indication or guarantee of future performance. Returns assume reinvestment of dividends, interest, and capital gains. Indexes are unmanaged, do not incur fees or expenses, and cannot be invested in directly.
Chart of the Month: YCharts
Chart of the Month
Quote of the Month
“October. This is one of the peculiarly dangerous months to speculate in stocks. The others are July, January, September, April, November, May, March, June, December, August, and February.”
— Mark Twain, American writer, humorist, and essayist
Trailing Returns